When it comes to measuring the success of your business but you don’t look at your data, how do you really know if you are doing well?
Sure, if you are an e-commerce business and can see decent money coming in you know you aren’t doing bad, but by not analyising the appropriate data – you could be missing out on the opportunity to be doing even BETTER.
Google Analytics
Google Analytics tracks how users interact with your website or app. It shows sources, numbers, locations and more. So you could make informative marketing and business decisions.
Quick set-up guide
Have you installed and prepared your Google Analytics? If not, here’s a guide to G4 set-up (a new version of Google Analytics)
G4 is a new Google Analytics option. The guide below is for the original set-up.Here’s a guide to G4 analytics (similar)
Audience – This overview allows you to understand the amount of people visiting your website. Numbers alone might not mean much, but you can compare this data year on year, to see if your business is moving in the right direction.
Select audience an overview to see main features of the data set (mark 1)
Choose a time frame to see specific options for it (mark 2)
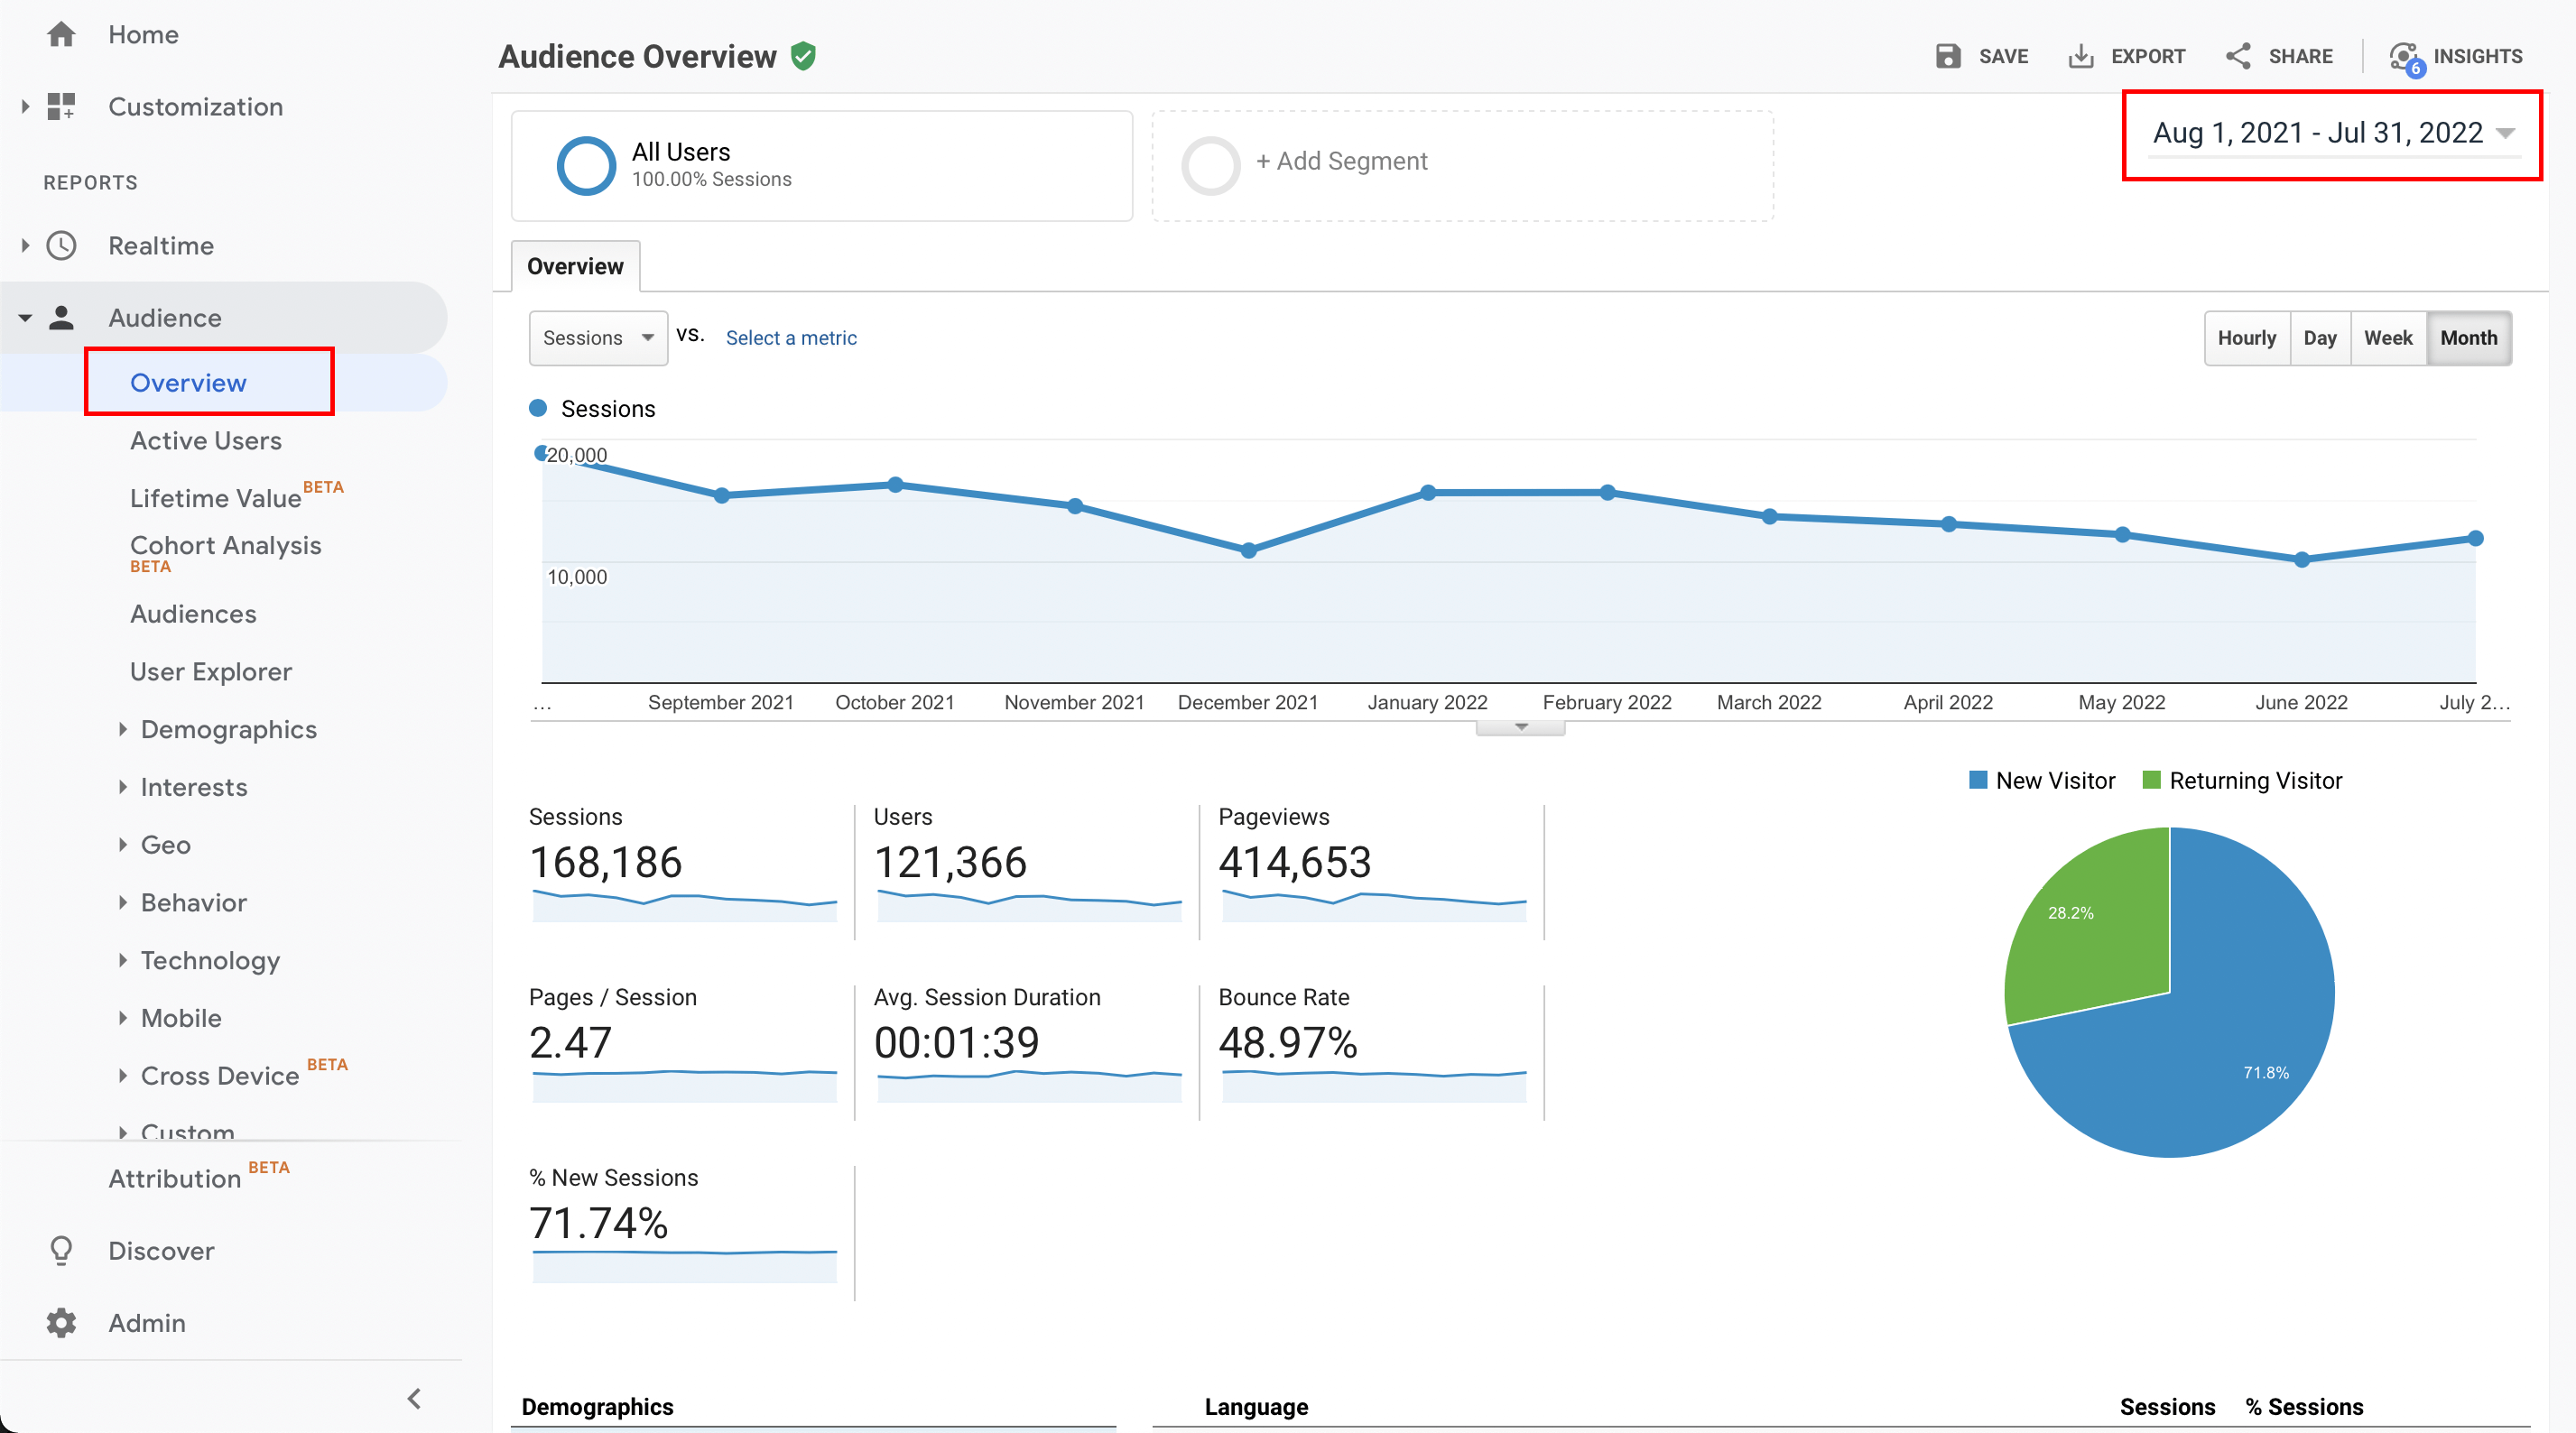
Here are the audience stats worth knowing:
- Sessions – A visit interactions by users
- Users – a person visiting the website or app
- Pageviews – total views of pages per total visitor numbers
- Pages/Sessions – total pages per sessions
- Average Session Duration – how long on average users interacts with your website/app for
- Bounce Rate – percentage of users that left the website/app after visiting a single page
- New Sessions – how many of the sessions are by the new users
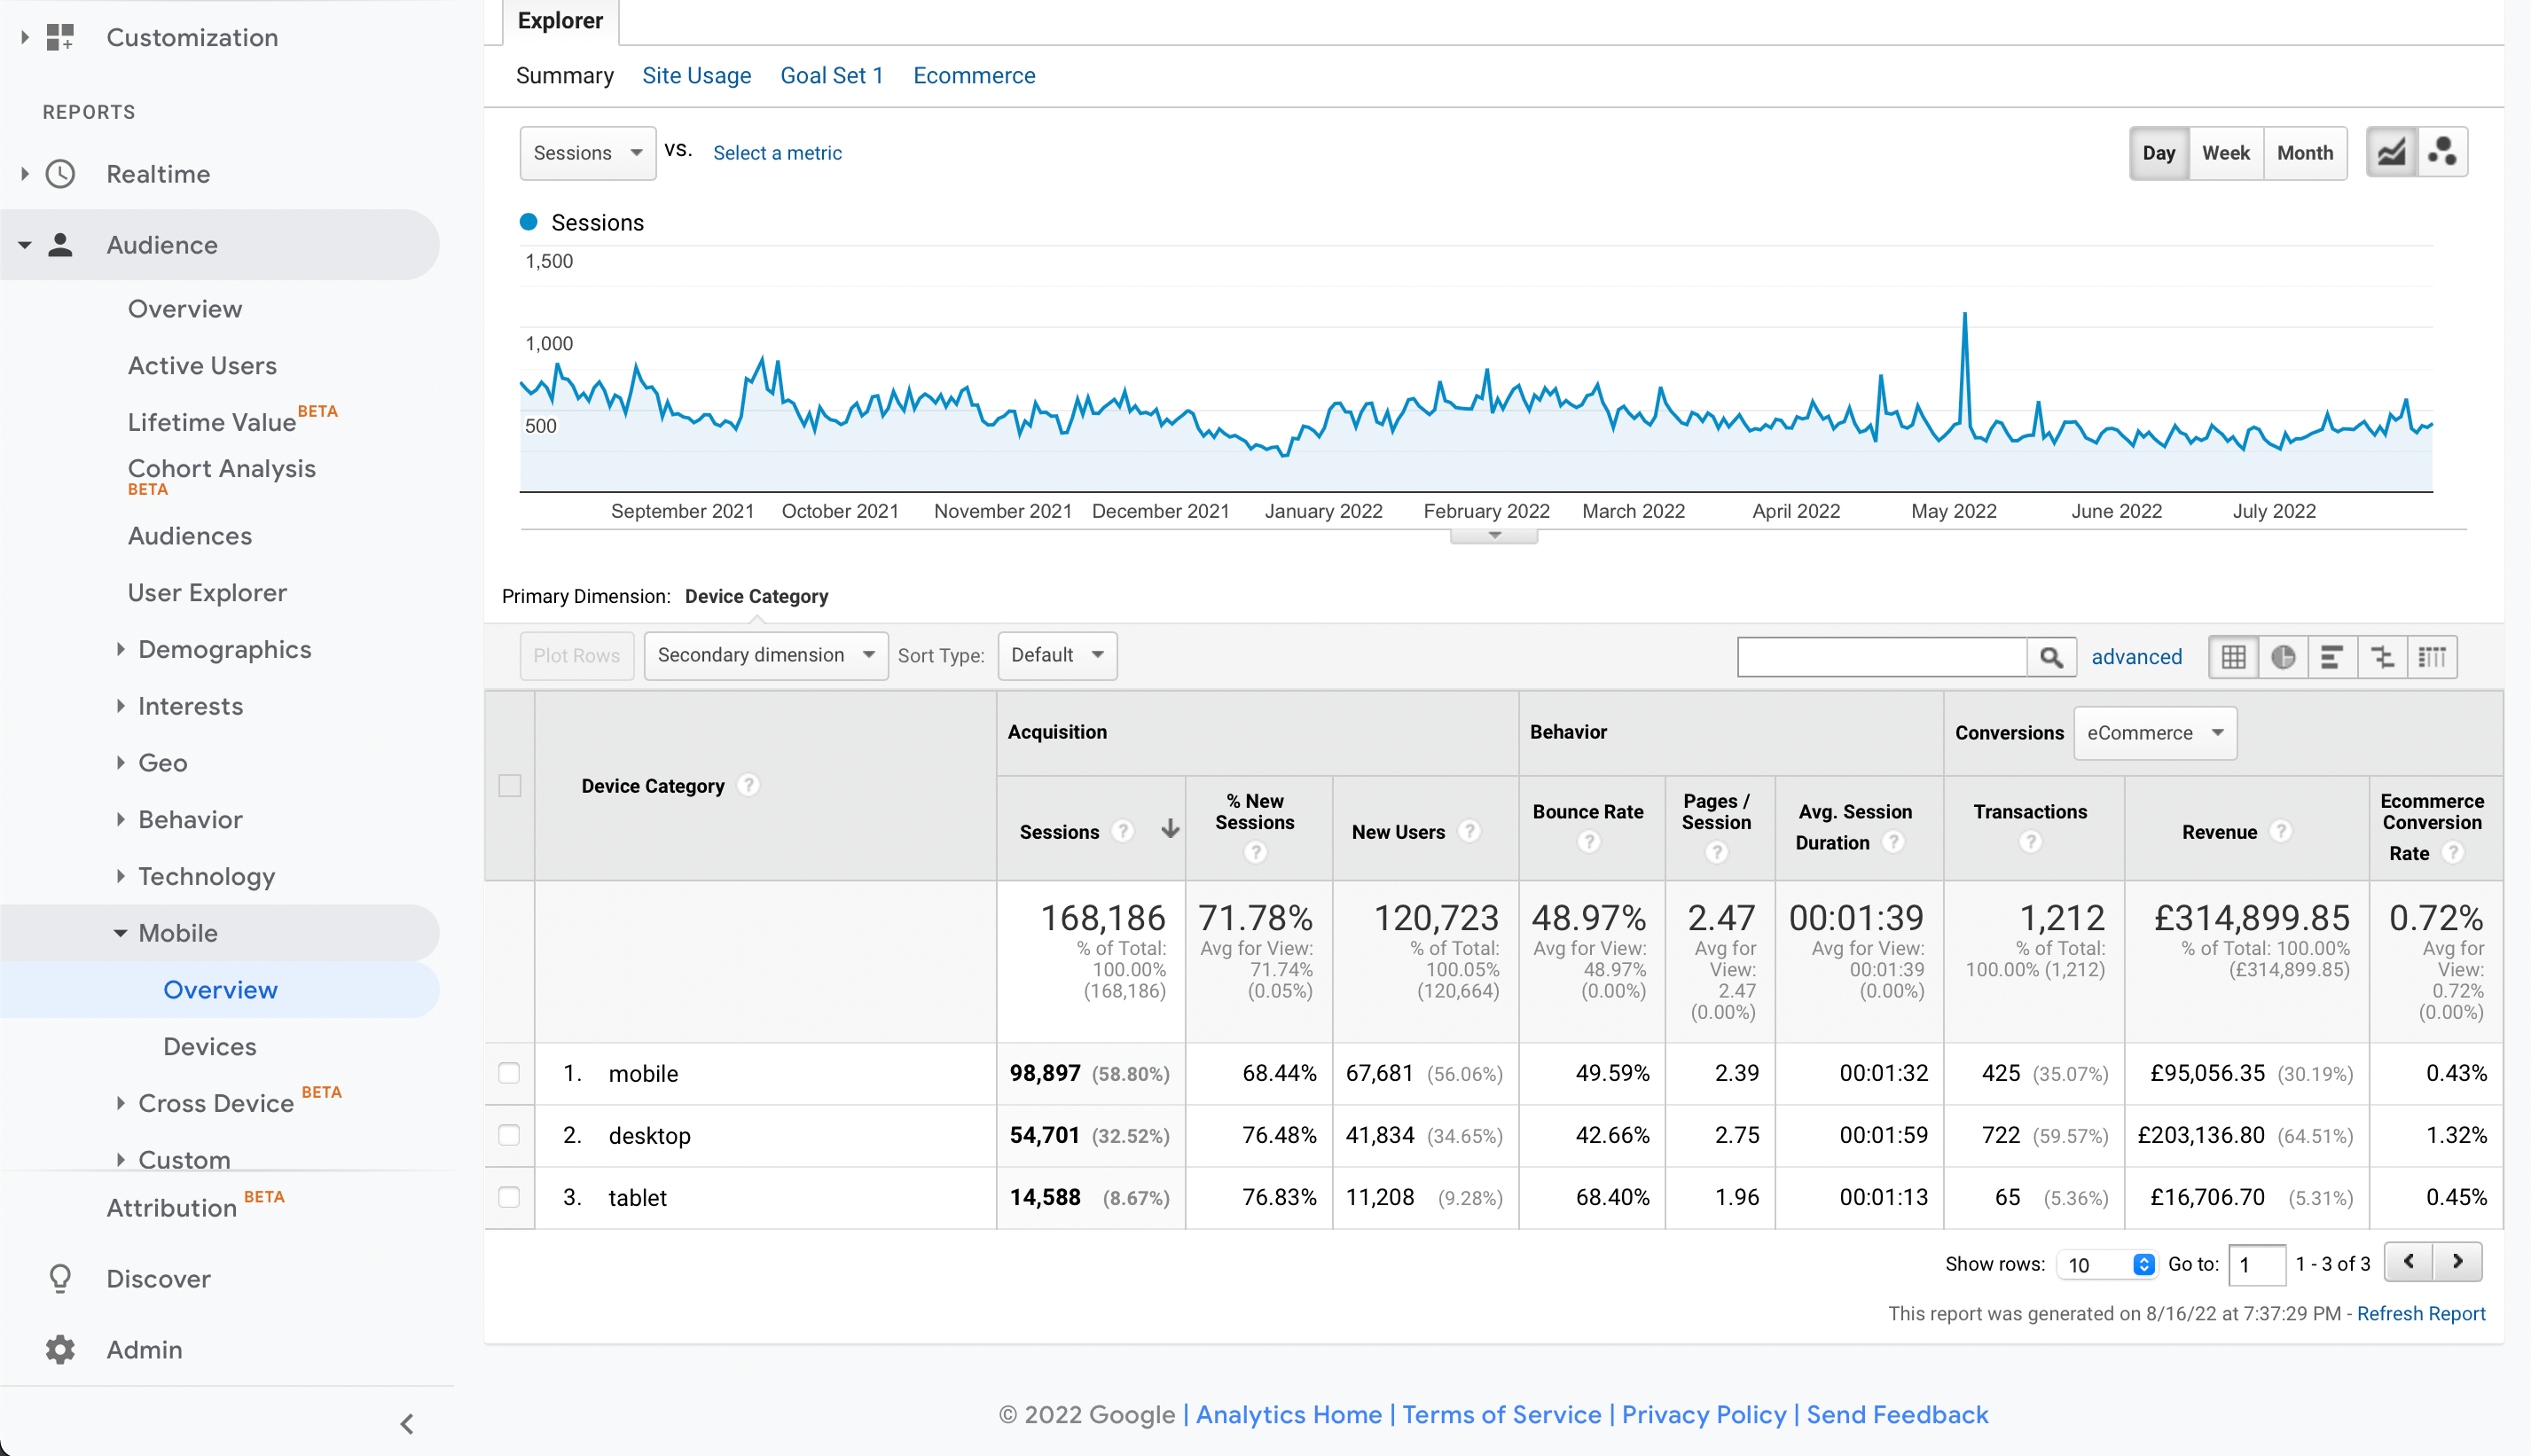
Devices – By viewing and understanding how users access your website, it’ll help you to ensure your website is functioning and accessible via these devices. It will also help with strategic planning of ADs, content and more knowing how the information will be viewed depending on each device.
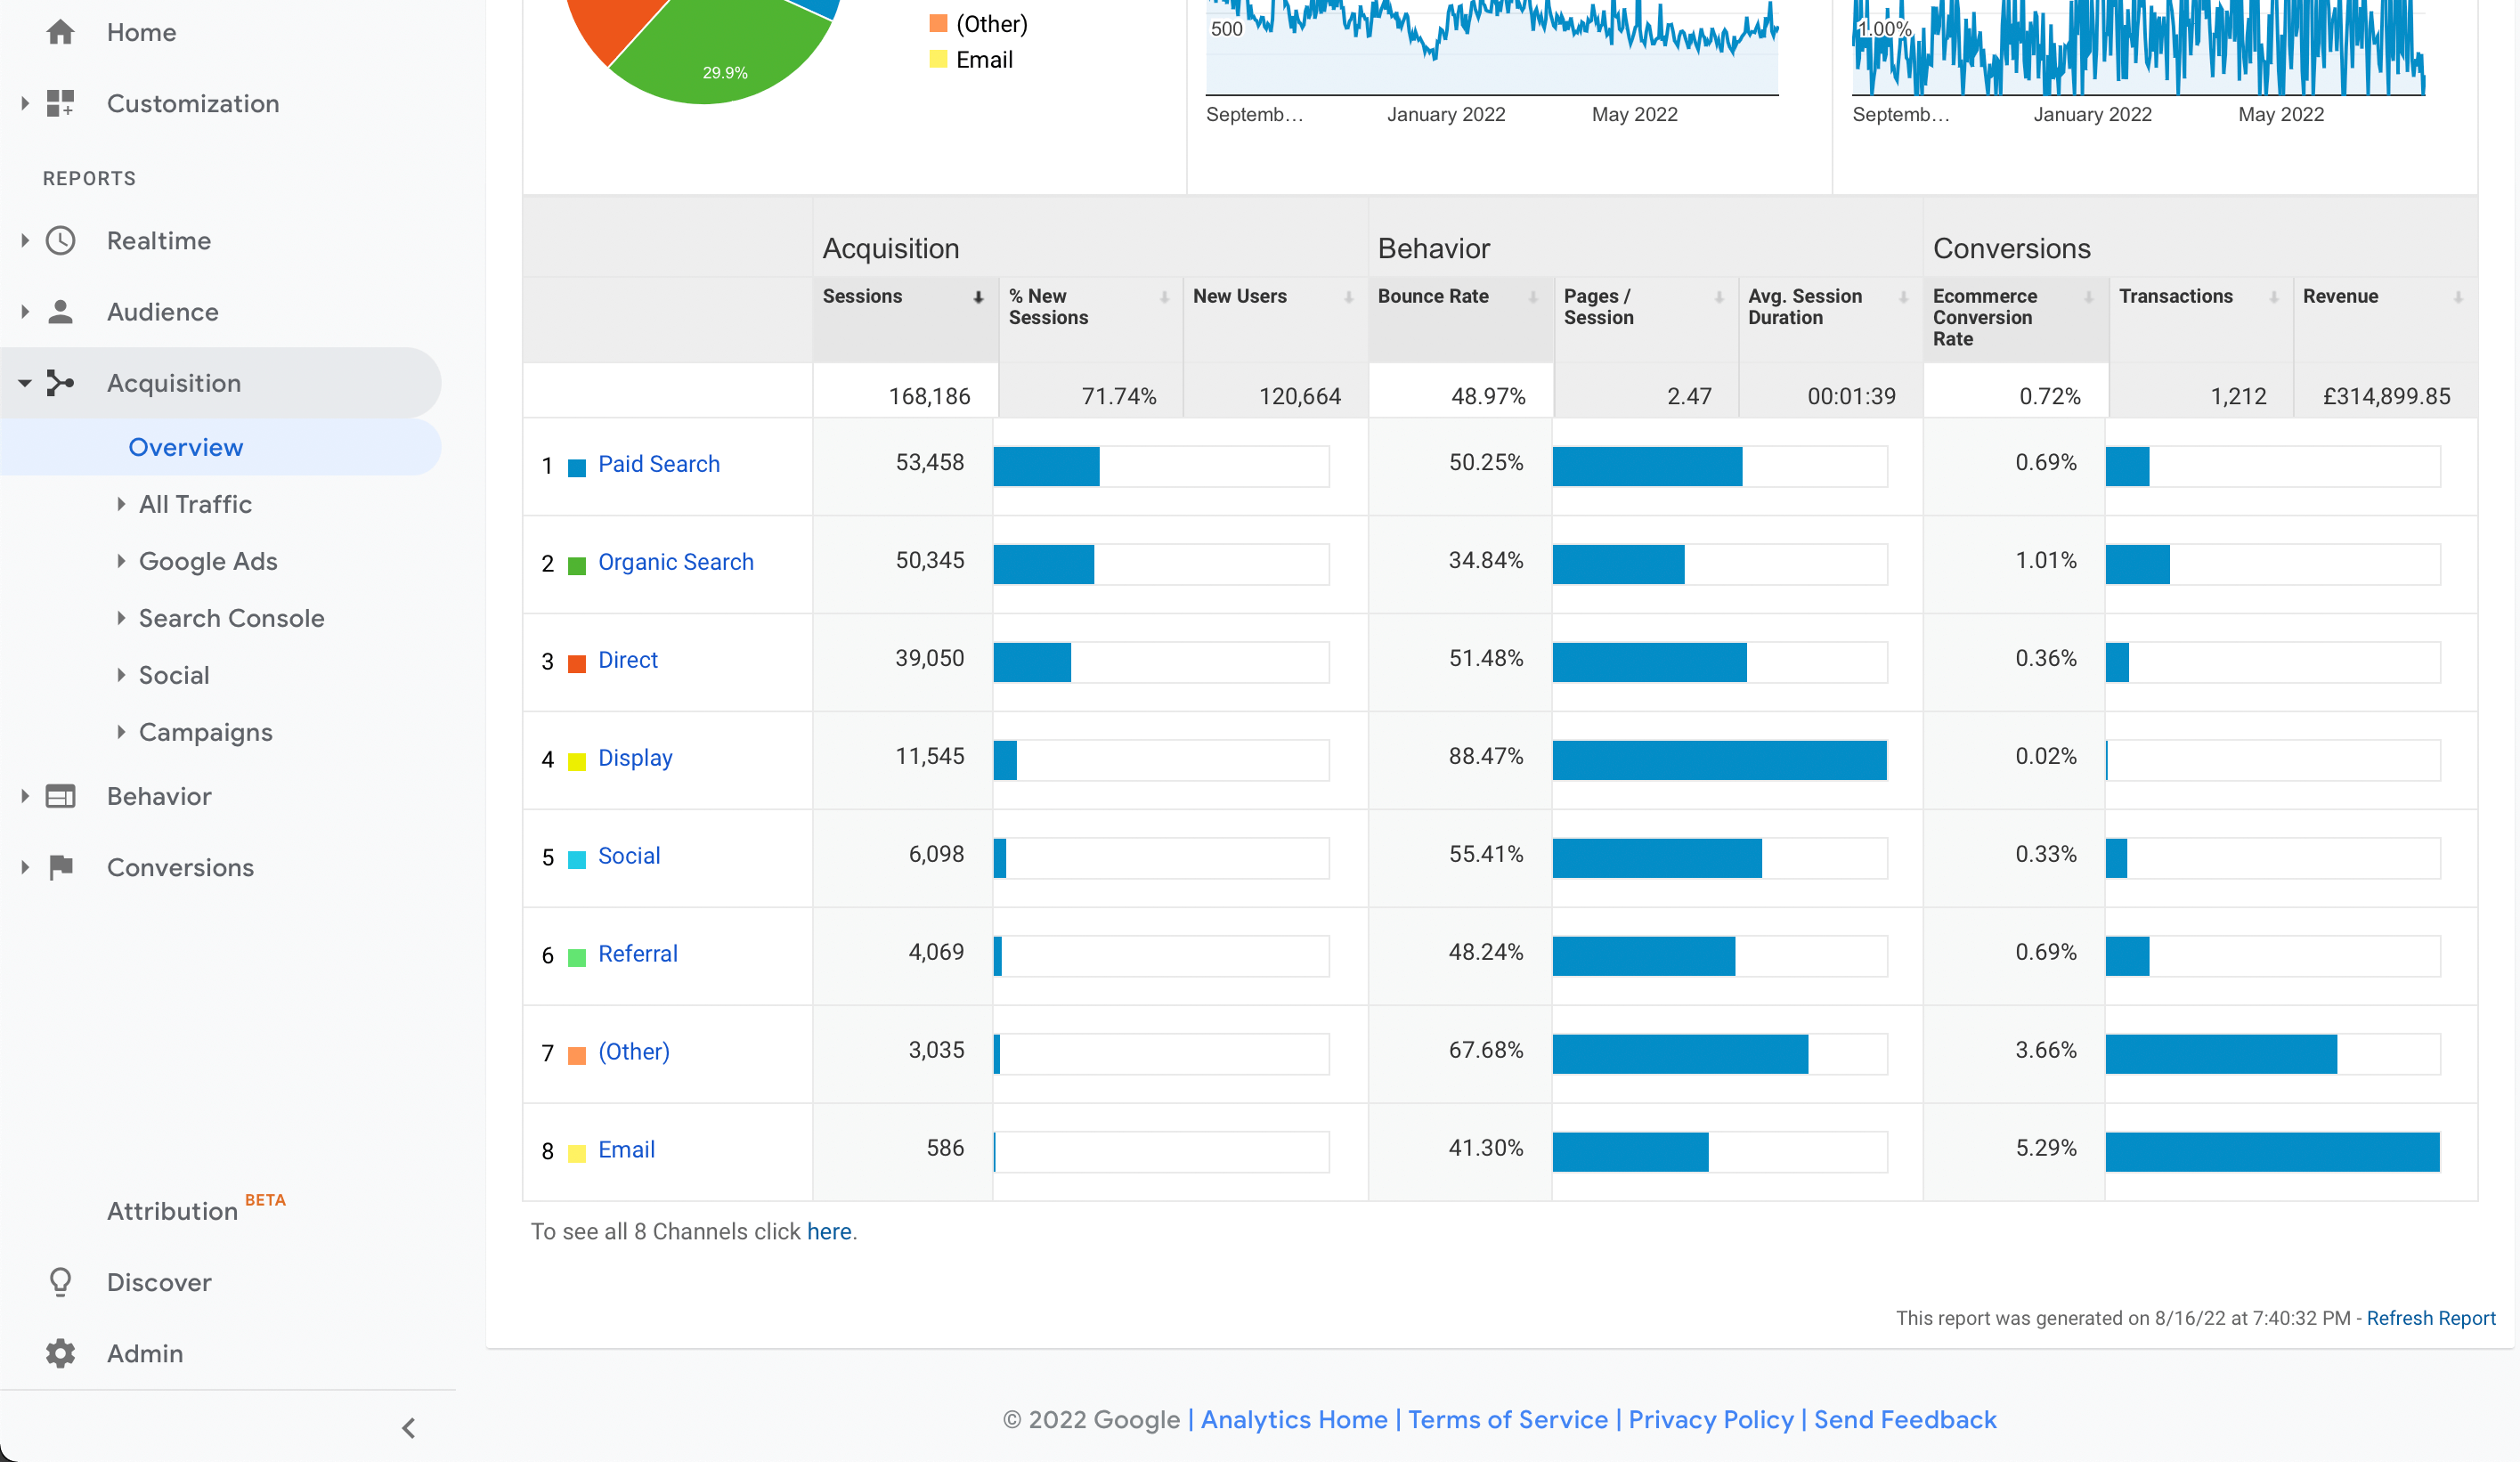
Acquisition – This shows sources that reach your website. It tracks conversion rates and provides a value to each source
- Organic search – all users visiting your website who have found you on Google and other search engines
- Paid search – your advertising cost, traffic and value from Google Ads
- Direct – users typing your website name straight into their browser, it’s usually done by people who already have visited your website and are returning users with saved information in their browser
- Social – users visiting from social media platforms
- Referral – user traffic from other websites, it might be guest posts, tripadvisor or anything else
- Email – user traffic from your email campaign, your email signature and more
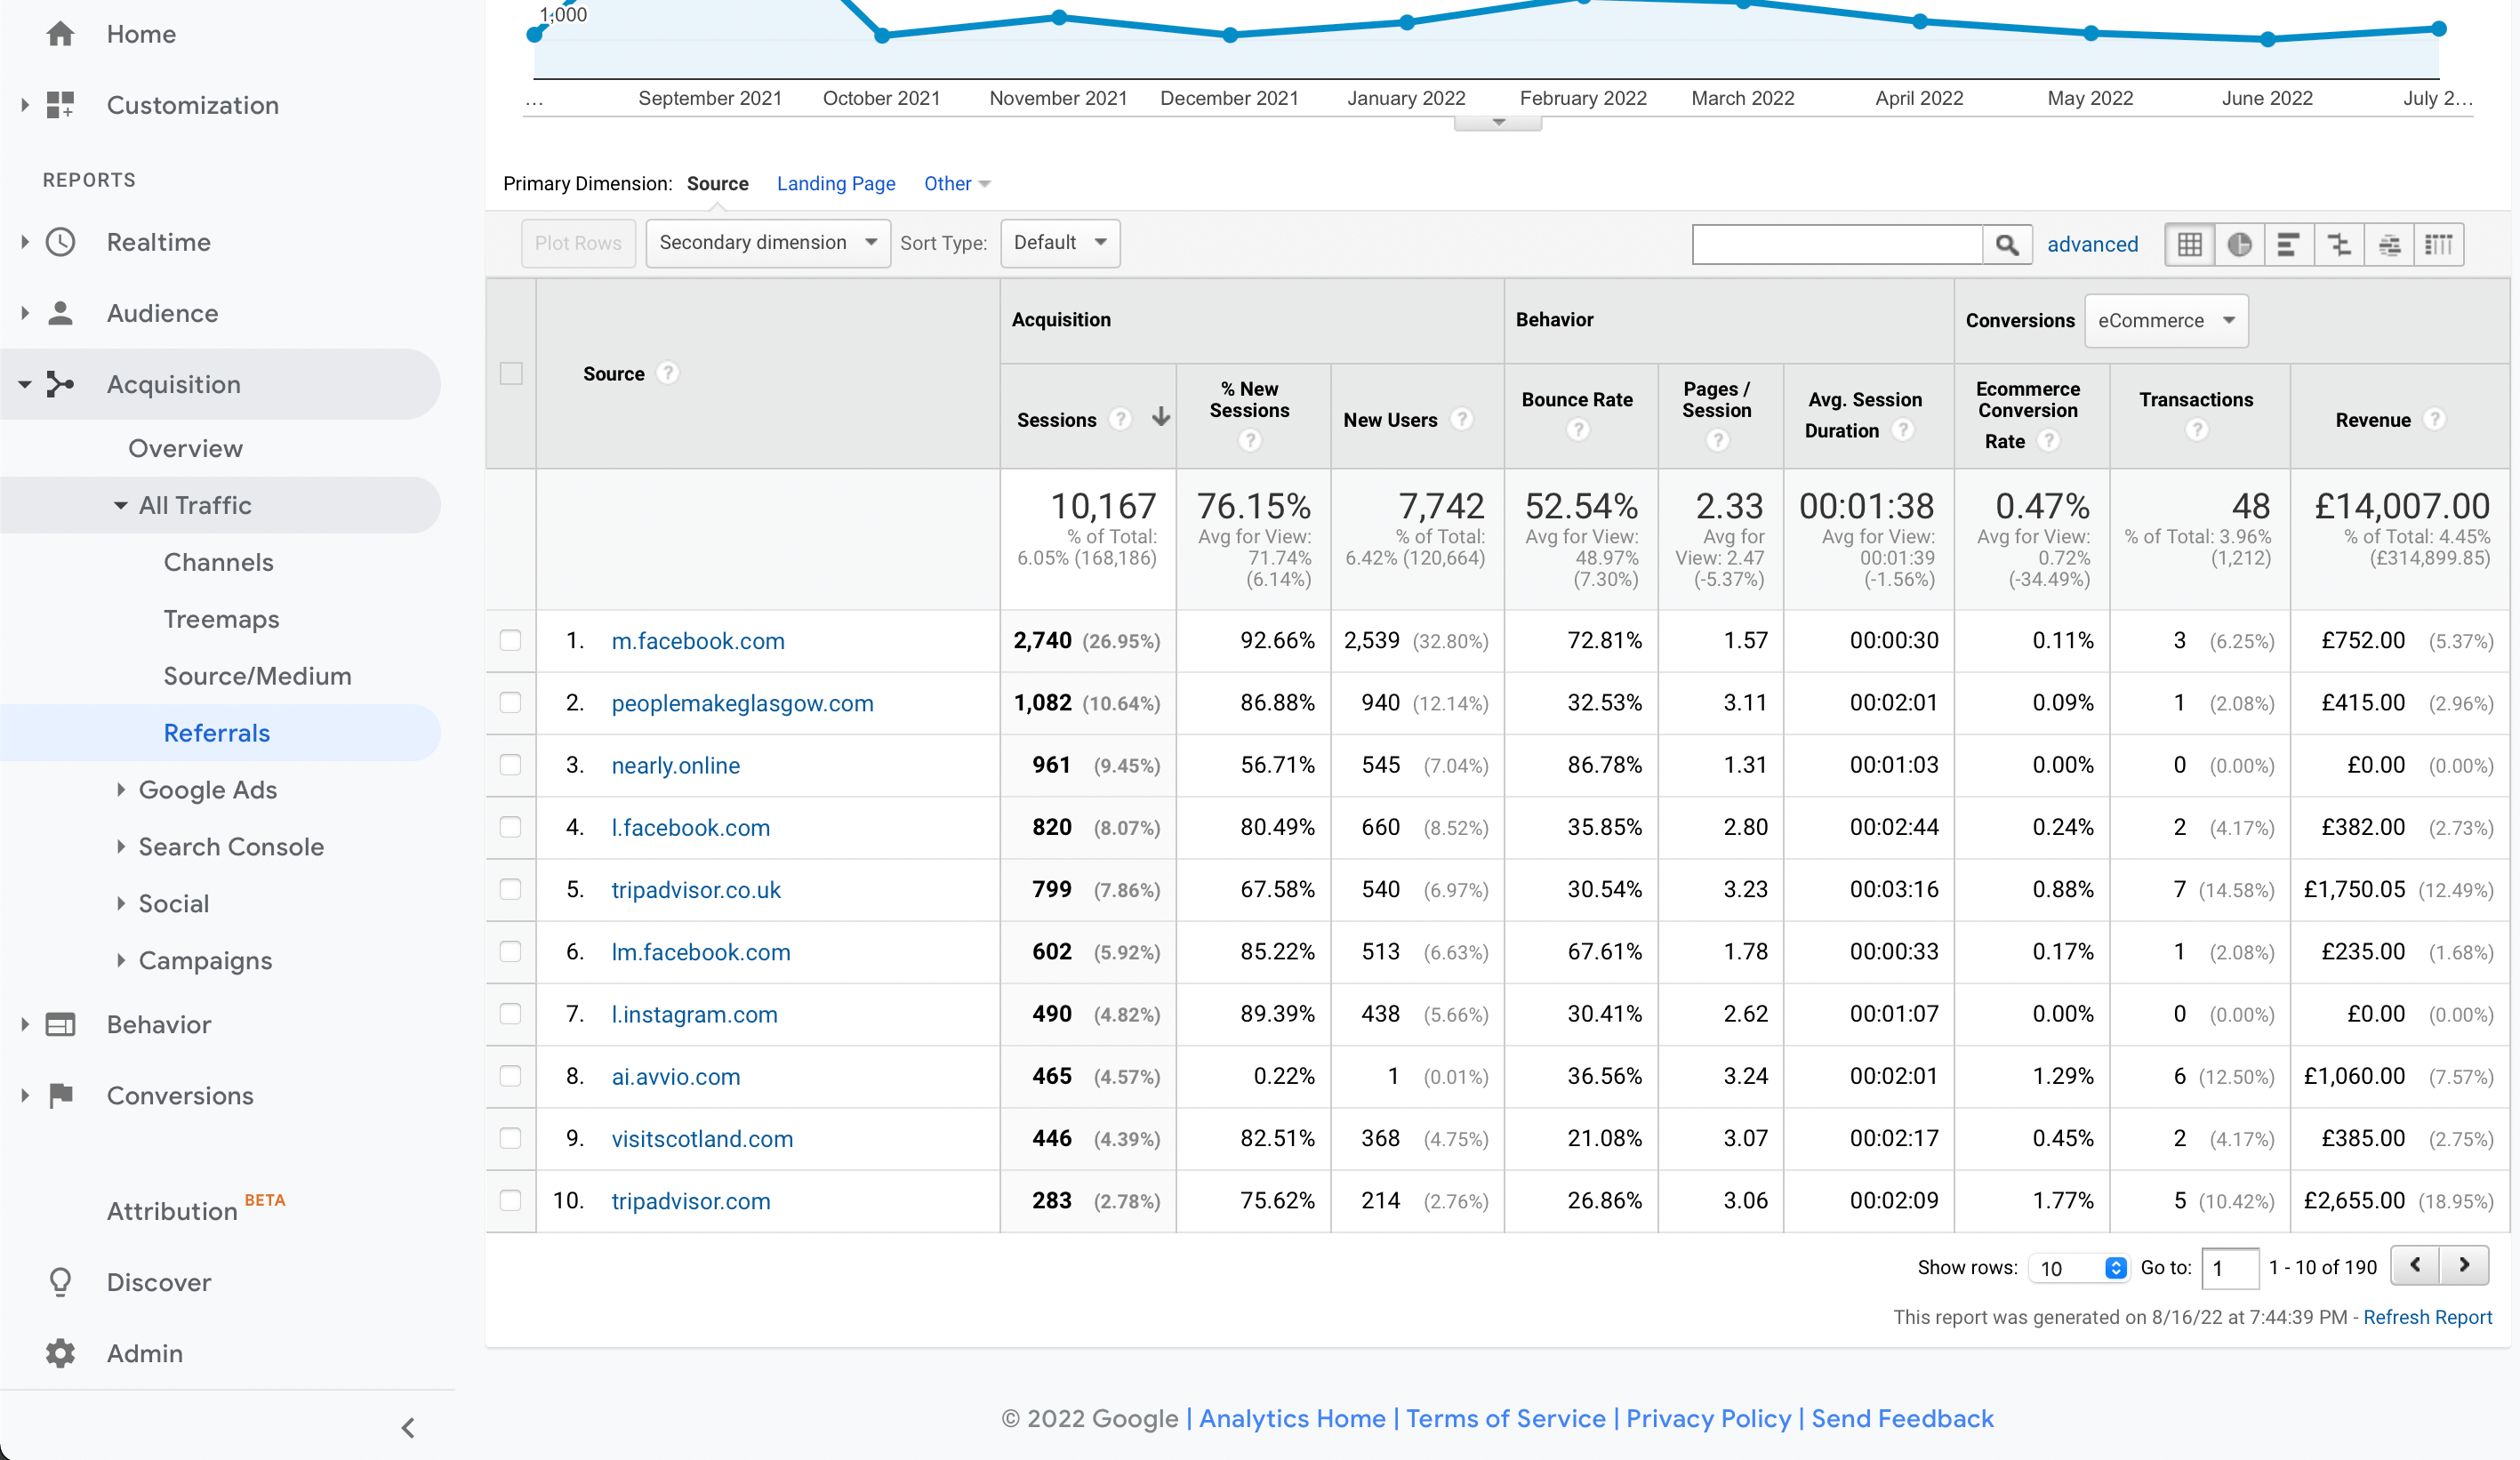
Referral traffic – it’s important to understand the sources that bring traffic to your website. It’s a very useful tool to see if your campaigns and listings are working, the number of users it brings in and the value it adds to your business.
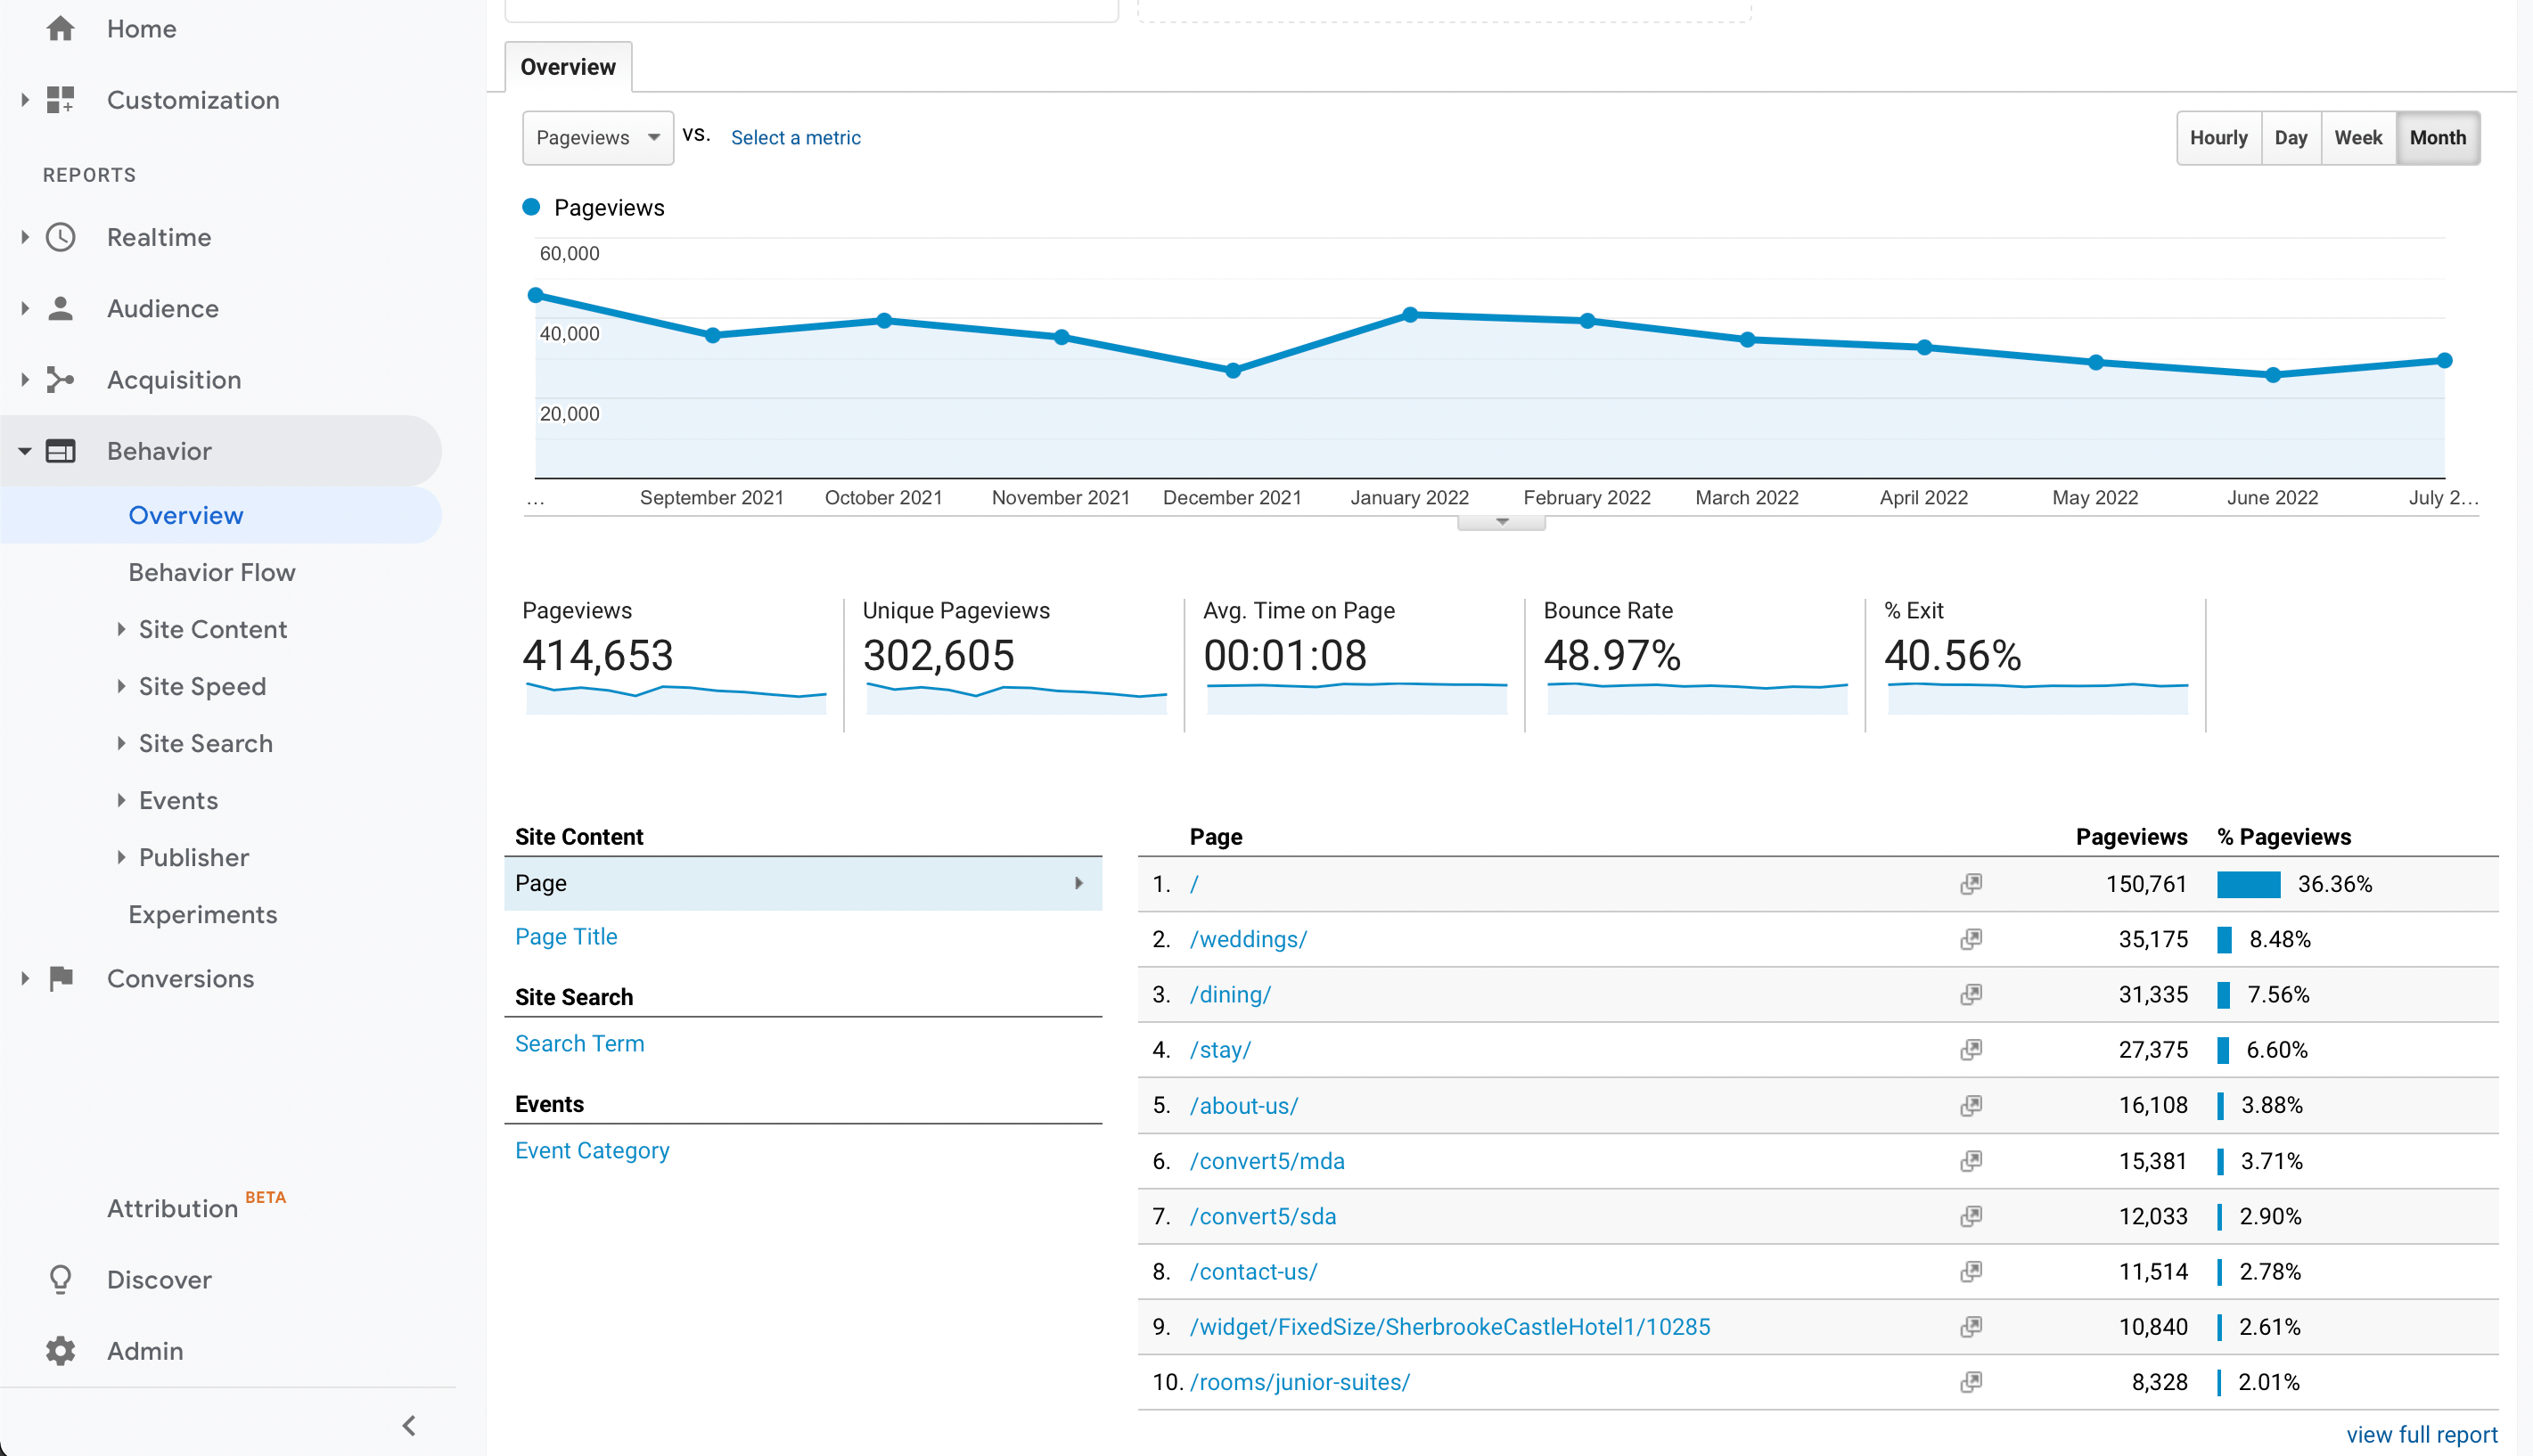
User behavior allows you to understand what pages people visit the most and what value it brings.
Your focus should be:
- Avg time on page – How long a user viewed a particular page
- Bounce rate – measures the percentage of people who land on your website and do completely nothing on the page they entered. For example, if 200 users visit your website (total sessions) and 10 of them exit without triggering another request (single-page sessions), your website’s bounce rate is 5%. When it comes to bounce rate, be sure to focus on the pages that matter as you may have high bounce rates that are perfectly normal, like those of blog pages
The above metrics will help to improve your website experience, as the longer the time spent on a page and the lower the bounce rate, it increases your chances of having an engaged user that will convert into sales.
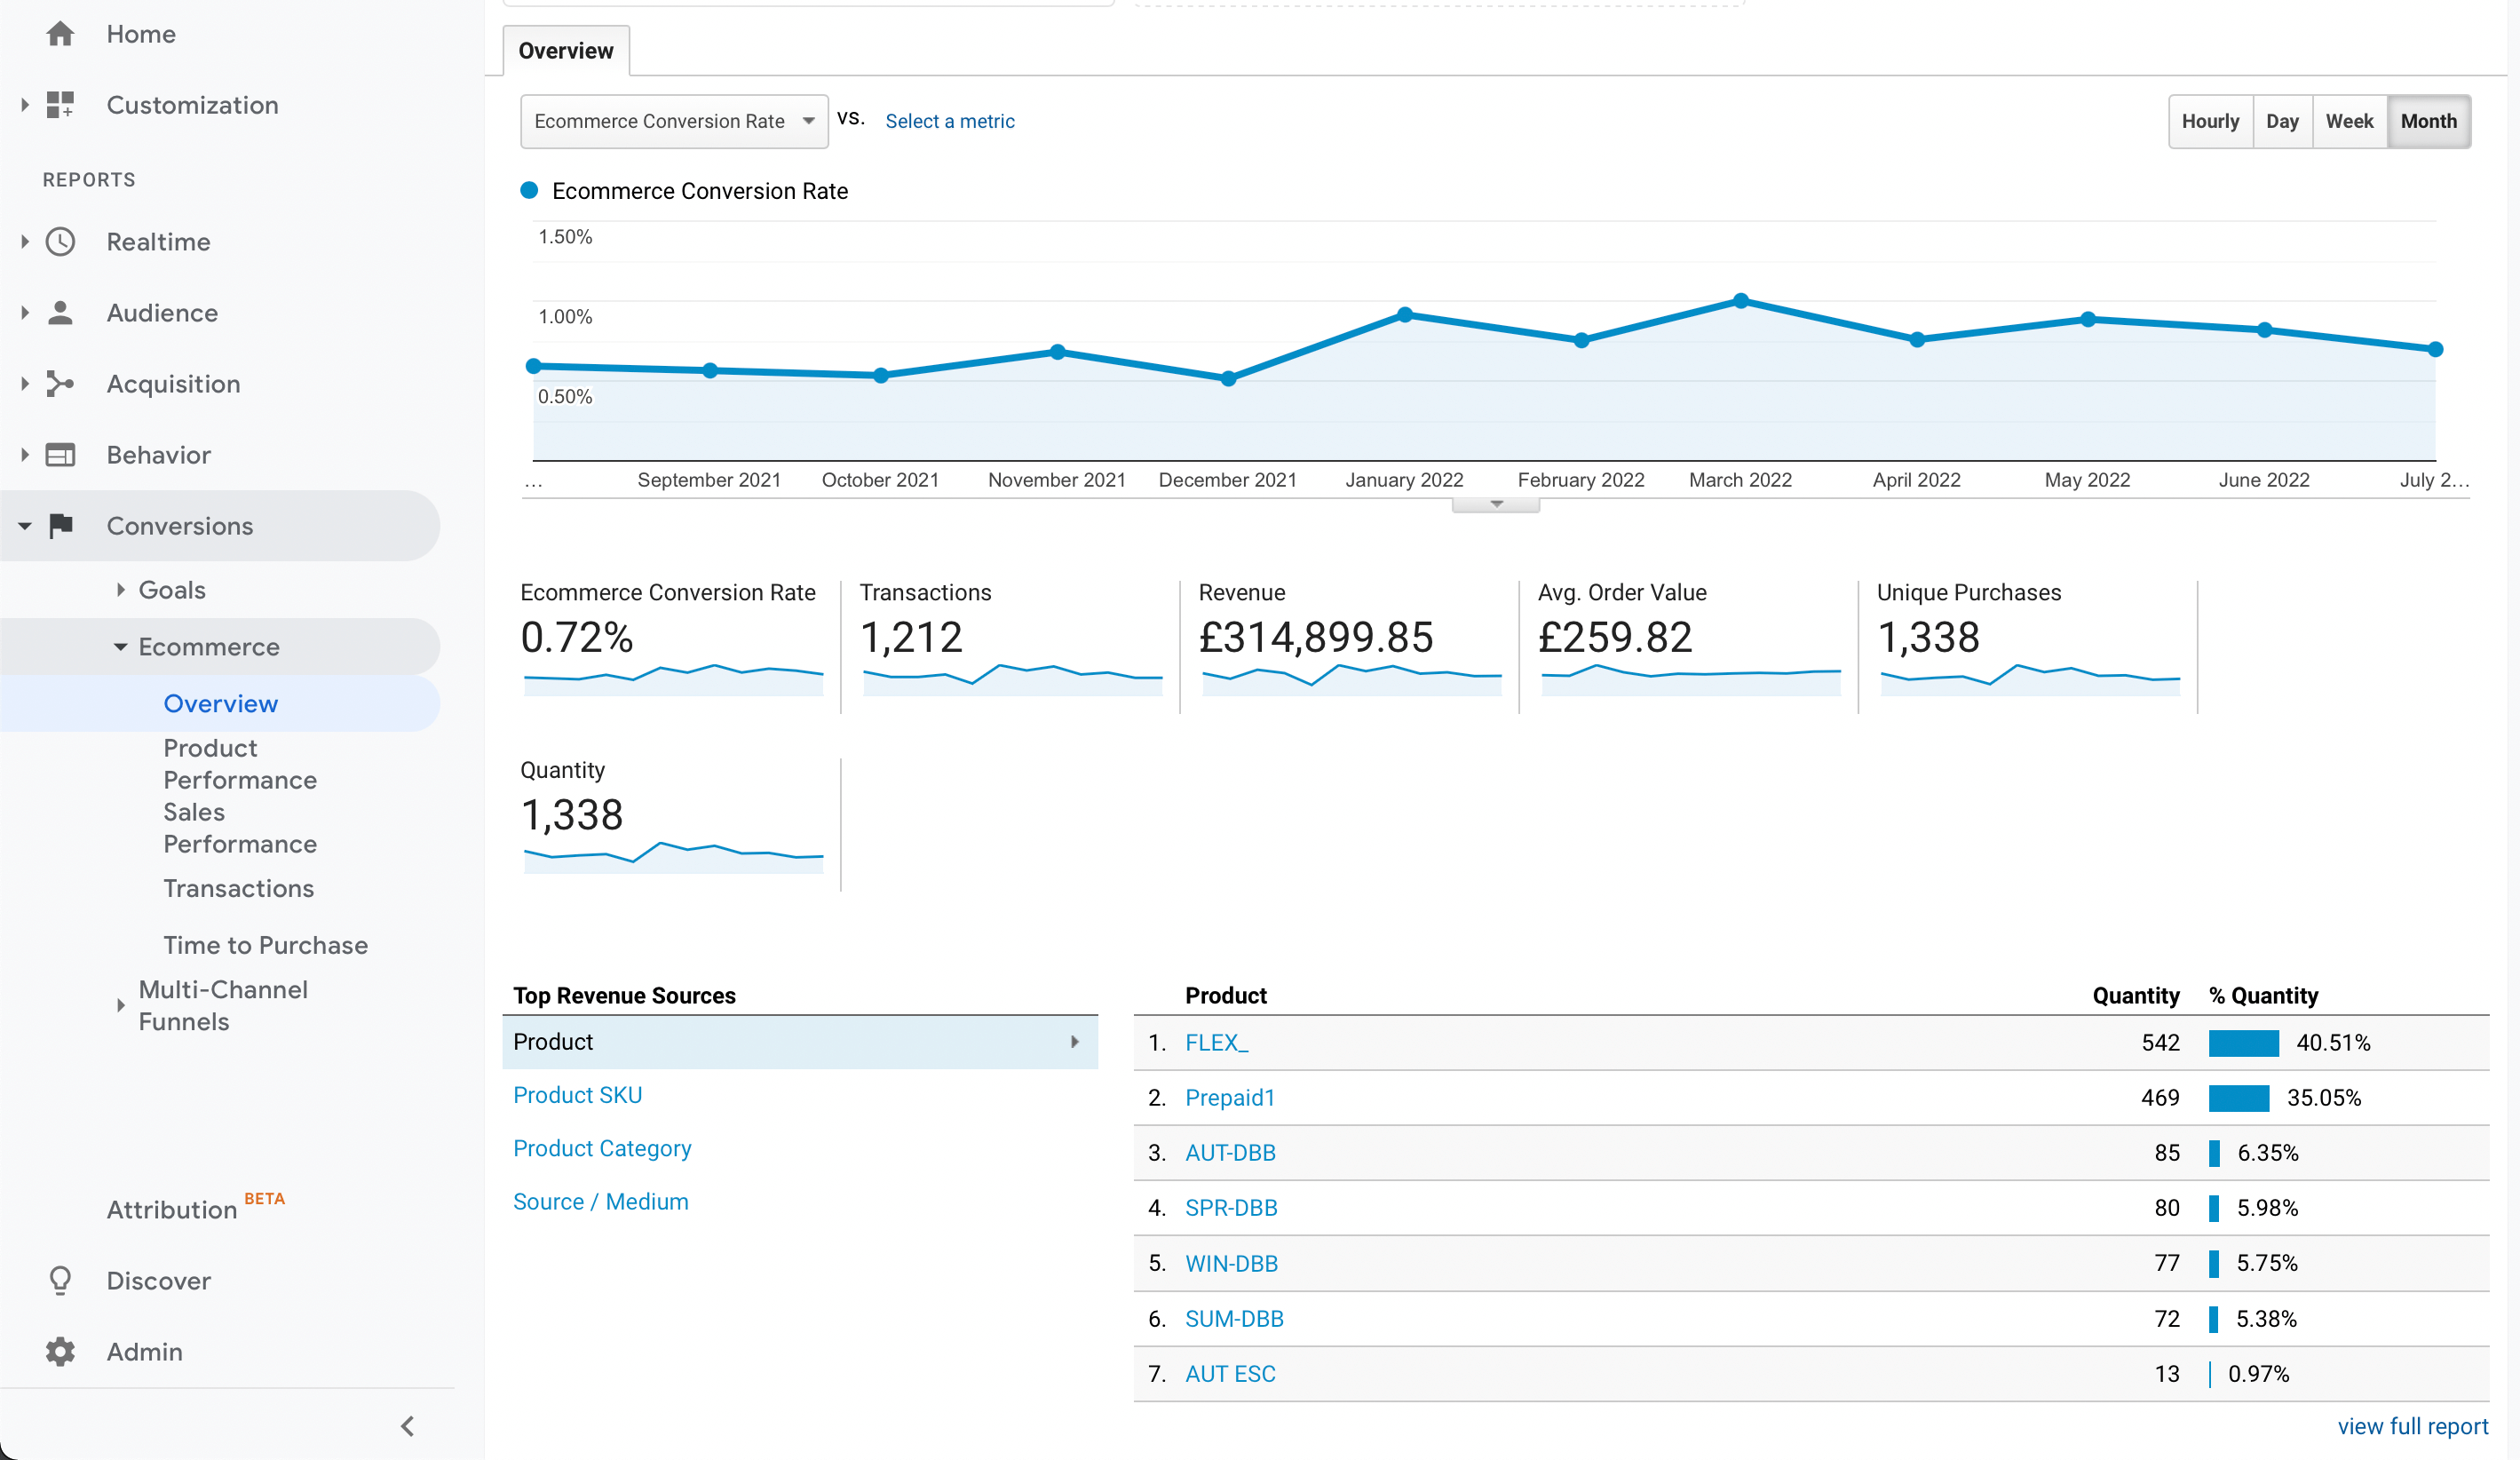
Conversions – The primary focus of the conversions section is for e-commerce websites to track sales, add to carts and checkout performance. But don’t worry if you don’t have an e-commerce store, as you can create custom events to track form submissions, click to call and email. (You can find out more about those on our Google Tag Manager guide here.)
- Conversion rate – The conversion rate is the number of conversions, divided by the total number of visitors. For example, if an ecommerce site receives 100 visitors in a month and has 25 sales, the conversion rate would be 25 divided by 100, or 25%
- Transactions – an ecommerce metric that measures sales activity on your website. (How many customers have bought from you)
- Revenue – Revenue is the money generated from products being sold on your website.
If you review the above information on a regular basis, compare it to previous periods. It’ll help your business to understand the website’s importance, performance and how to improve it.


